Publish live reliable actor telemetry from service fabric
a year agoAfter you’ve got your service fabric application live, you might see performance issues which you didn’t pick up in testing or simulated load tests. This could be for a number of reasons.
- Unexpected actor bottleneck, they are single threaded.
- Time spent waiting on a bottlenecked actor.
- Large state affecting IO performance.
Reliable actors do not yet have interception interfaces to add in this kind of detailed telemetry, but with careful code its possible to do this with a dynamic proxy. I chose to use LightInject for this but most of the framework would do the same job. I use statsd and graphite as my telemetry platform and I’ve had good experiences with this nuget package
We need to intercept object on both sides of the network boundary to cover these scenarios.
- Service fabrics initialisation to trace OnLoadStateAsync, OnActivateAsync, etc…
- Fabric client initialisation to trace client interface calls IActorInterface.YourDoWorkMethodAsync.
We can trace the former by using service fabrics dependency injection support to initialise the actors with a proxy inbetween. First we override fabrics initialisation to use our DI container which has dynamic proxy support.
|
Next we tell our DI container to resolve these types with a proxy that includes our telemetry interceptor.
|
This will catch the timings for any calls to actors made by the fabric system. Now we need to get the timings for all the calls we make, both actor to actor and client to actor.
|
Above we’ve created a factory class which should be used by clients and actors to create the proxied ActorProxies. We cache the generated proxy types in a thread safe dictionary as they are expensive to create.
Lastly we need the intercetor itself. We need to be sympathetic towards:
- All actor calls return a Task.
- Avoid blocking calls by calling
ResultorWaiton the task.
We can use a task continuation to handle the writing of telemetry together with a closure to capture the timer. If there is a return value we should return it, and for whatever reason that value is not a Task then we won’t try to add the continuation.
|
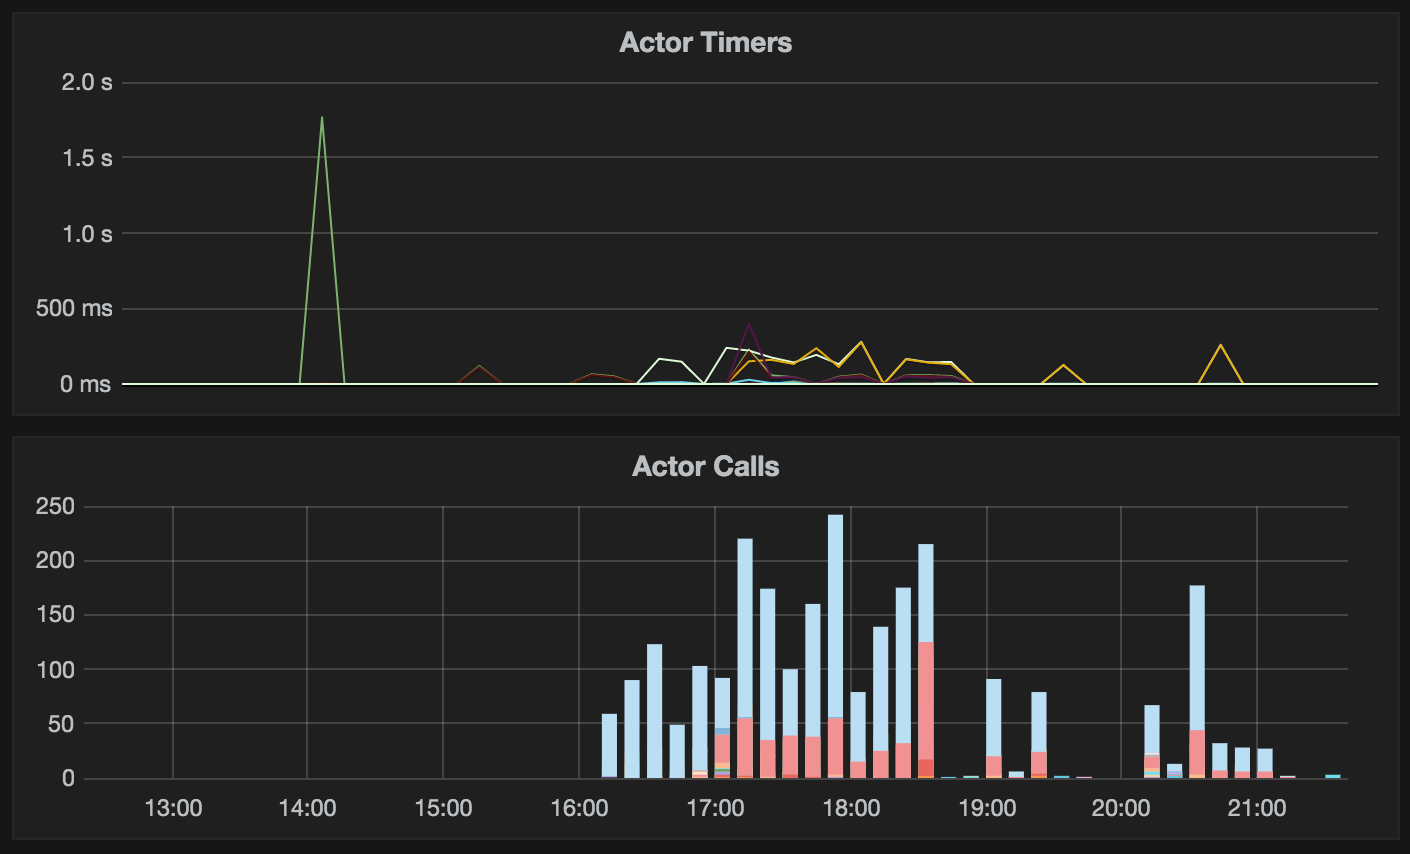
If you have your metrics library configured to push to a graphite backend you can use the following query to graph it:
|
