NugetXray - Be proactive in keeping your packages up to date
29 minutes agoThe package management features within Visual Studio are fantastic when working within a single solution. It lets you know when there are new packages available and you are referencing multiple versions of the same package. There are some scenarios which could be improved:
- It’s easy to forget to check whether there are new versions.
- Solutions composed of packages output by different repositories.
Some of our applications have code distributed across different repositories and packages. Since these are different solutions its difficult to use existing tools to detect when these packages are getting out of sync. NugetXray has commands to do just that.
It’s available at nuget.org.
|
There are currently two commands: one to find out of date packages and another to find package version mismatches.
Find packages with newer versions
To generate a diff report:
|
This shows us how many major, minor or patch versions we are behind by. You can generate a report across multiple repositories by setting the directory parameter to the root of both repositories.
You can also output either json or html if you want to build further tooling around it. The html report can included as a third party teamcity report.
|

Find packages which need consolidating
To find whether you have multiple versions of the same package, you can run the duplicate command.
|
As before you can include multiple solutions under a single root directory to find duplicates across solutions. It also supports both Json and Html output.
Fail the build
If you want to integrate it with your build process, and fail when there are packages which need updating or consolidating, you can use the exit code. If calling from PowerShell you can get by calling $LASTEXITCODE. A negative exit code is returned to indicate there are results.
|
Verbose flag
If you want more details output around the failures and which packages.config they refer to you can specify the verbose flag.
If you have any feedback or feature requests you can create an issue or reach me @naeemkhedarun.
OctoSearch - Cache and search Octopus Deploy variable sets
3 months agoWhen putting together new deployments the octopus deploy interface does a great job. Unfortunately, when you have hundreds of deployments and thousands of variables it can become difficult to find and navigate the variables without search and filter functions.
As a stop-gap to Octopus hopefully adding this feature I’ve created OctoSearch. This allows you to download and cache the variable sets with their variable collections locally as Text, Json or Html.
OctoSearch itself is a package available from nuget. It has been compiled down to a native executable so a dotnet core installation is not needed.
|
The first step is to login with the octopus server so we can create, download and cache an API token. This will be used for subsequent calls to octopus.
|
Now that we’re authenticated we can download and cache the variable sets and their variable collections. This cache will be used for our searches to reduce the load on the Octopus server. Variables marked as sensitive won’t have their values downloaded or cached; their variable names will be searchable but not their values.
|
With the variables cached locally you can run fast searches and regenerate them into either Json or Html documents. To run a basic command line search you can use the search verb. It takes a regex so you can pass in basic text or more advanced text searches when you need to.
|
To output the search results into a text file you can do:
|
To display all the variables in a html report we omit the regex to default to a greedy regex \w.. The html report has a client side search facility to filter variables for easier exploration.
|
This will give you a search UI that looks like:

If you would prefer it in Json:
|
Once we have it in Json we can load and analyse it within powershell. For example to get all the variables marked as IsSensitive we could do:
|
If you have any feedback or feature requests you can create an issue or reach me @naeemkhedarun.
HttpClient DNS settings for Azure Cloud Services and Traffic Manager
4 months agoAt my current workplace, some of our systems are approaching 1 Billion requests per day. At these volumes sub-optimal configuration between systems can cause significant issues and subtle performance degradation. To understand some of the issues we are facing I’m going back to basics. You can find the code for this post at https://github.com/naeemkhedarun/TestHttpClient.
Thanks to Aliostad for his analysis on the HttpClient and fschwiet for writing the .NET hosts library which I’ve now taken off my own to-do list.
There are two DNS level scenarios that I want to investigate:
- Connect to the production cloud service slot after a VIP swap. Clients connect to a cloud service using a
cloudapp.netDNS name which points to the Azure Load Balancer distributing traffic over the nodes. - Resolve the latest Traffic Manager configuration. Traffic manager is a DNS level load balancer. Clients resolve a traffic manager address to an IP address and connect directly to the endpoint. So what happens when the IP changes? We’ll try the scenario with both a Transient and Singleton HttpClient.
Transient
|
133721ms
The transient client eventually behaves as expected despite taking 133 seconds to respect the change. The ServicePointManager.DnsRefreshTimeout defaults to 120 seconds. This still leaves 13 seconds unaccounted for which I suspect is the final socket connection timeout.
A test isolating the connection to the non-responsive endpoint yields:
13086ms
I wasn’t able to find any configuration for this timeout within .NET but I didn’t manage to trace the framework source to an enumeration WSAETIMEDOUT. The timeout is controlled by the OS documented here.
TCP/IP adjusts the frequency of retransmissions over time. The delay between the first and second retransmission is three seconds. This delay doubles after each attempt. After the final attempt, TCP/IP waits for an interval equal to double the last delay, and then it closes the connection request.
You find the default values for your OS (in my case Windows Server 2016) by running:
|
So the result should be (1 * 3000) + (2 * 3000) = 12000ms which explains the extra time. Now the result is understood, let’s re-run the test after dropping the DNS refresh timeout to 10 seconds.
|
25026ms
So with a transient HttpClient a working way to stay up to date with traffic manager configuration is to tune the DnsRefreshTimeout property to a good value for your application.
Singleton
Using a singleton client will reuse the connection for many requests to reduce the overhead with starting new TCP connections. In this setup we still want the connection to be recreated occasionally so we get the latest DNS configuration.
|
Cancelled after 180000
With a singleton HttpClient the connection is kept alive by default. This can be undesirable in configuration changes or scale out scenarios where you want your clients to connect to and use the new resources. Let’s try the DnsRefreshTimeout.
|
Cancelled after 180000
Since the connection is open and kept open, we need to find a way to close it. There is another setting which controls the length of time a connection is held open for called ServicePointManager.ConnectionLeaseTimeout.
|
145558
Unfortunately, having this setting alone isn’t enough based on our previous transient experiments; the DNS is still cached. Let’s combine the two settings.
33223
So now, despite using a singleton pattern within the code, our connections are being recreated and re-resolved up to every 20 seconds (both timeouts combined).
Azure Networking Bandwidth: Public IP vs Peered Networking
6 months agoWe have a application setup which might be familiar to you; A cloud service in a classic virtual network (v1) which communicates with a database in an ARM virtual network (v2). Ideally we would like both of these services in a single network, but are restricted from doing so due to the deployment models. We had a discussion which involved performance, security and ideal topologies, however this post will solely focus on performance.
Is there a difference in latency and bandwidth when they are both hosted in the same region?
Test setup
To reflect the setup we have for our application, two VMs were provisioned in North Europe.
Source
- A3 (Large) Windows Cloud service
- Classic Virtual Network
Destination
- DS13v2 Linux Virtual machine
- ARM Virtual Network peered to the Classic VNet
Traceroute
I first wanted to test the latency and number of hops between the VMs. ICMP is not available for this test as we are hitting a public IP, however we can use TCP by using nmap.
|
|
We can see that there are 8 hops over the public IP, and as we expect only a single hop over the peered network. Both routes are still extremely fast with negligible ping times. This confirms my collegues suspicions; despite connecting to a public address the traffic probably never leaves the datacenters perimeter network.
Bandwidth (iperf3)
To measure the bandwidth available between the VMs I’m using iperf3 which is cross platform. The test is run from the windows machine as a client and flows to the iperf server hosted on the linux box.
|
| Seconds | Public IP | Peered |
|---|---|---|
| 1 | 985 | 996 |
| 2 | 951 | 947 |
| 3 | 975 | 976 |
| 4 | 936 | 956 |
| 5 | 989 | 962 |
| 6 | 958 | 965 |
| 7 | 967 | 962 |
| 8 | 959 | 926 |
| 9 | 964 | 985 |
| 10 | 961 | 948 |
| 11 | 968 | 953 |
| 12 | 960 | 980 |
| 13 | 949 | 957 |
| 14 | 976 | 966 |
| 15 | 960 | 949 |
| 16 | 966 | 972 |
| 17 | 959 | 954 |
| 18 | 966 | 975 |
| 19 | 961 | 969 |
| 20 | 964 | 963 |
| 21 | 965 | 962 |
| 22 | 962 | 933 |
| 23 | 962 | 993 |
| 24 | 958 | 961 |
| 25 | 967 | 958 |
| 26 | 963 | 958 |
| 27 | 961 | 956 |
| 28 | 963 | 970 |
| 29 | 965 | 962 |
| 30 | 962 | 963 |
Surprisingly, both achieve the desired bandwith (1Gbps) for the selected VM sizes.
I was still curious if the performance profile was the same when upgrading both VMs to support 10Gbps networking. For this test both machines were upgraded to the DS14v2 VM size. To maximise the bandwidth I used iperfs -P switch to run concurrent workers. The buffer size was also increased to see the effect it has on the bandwidth.
|
| Test | Bandwidth (Mbps) |
|---|---|
| Public IP | 2480 |
| Peered | 2630 |
| Public IP (32MB) | 3230 |
| Peered (32MB) | 2710 |
As expected, with the default values the peered network performed better although the difference was marginal. More surprisingly, the public network had a high thoroughput when the buffer size was increased and despite running the test multiple times I am unable to explain why.
For our workload and use case, I can say the performance difference between the two approaches is irrelevant. If you are evaluating whether you might gain network performance by switching to peered networking then I hope these numbers can help guide you. I would recommend running a similar test if you are choosing different VM sizes or workload.
Create a Chrome app for the Service Fabric Explorer
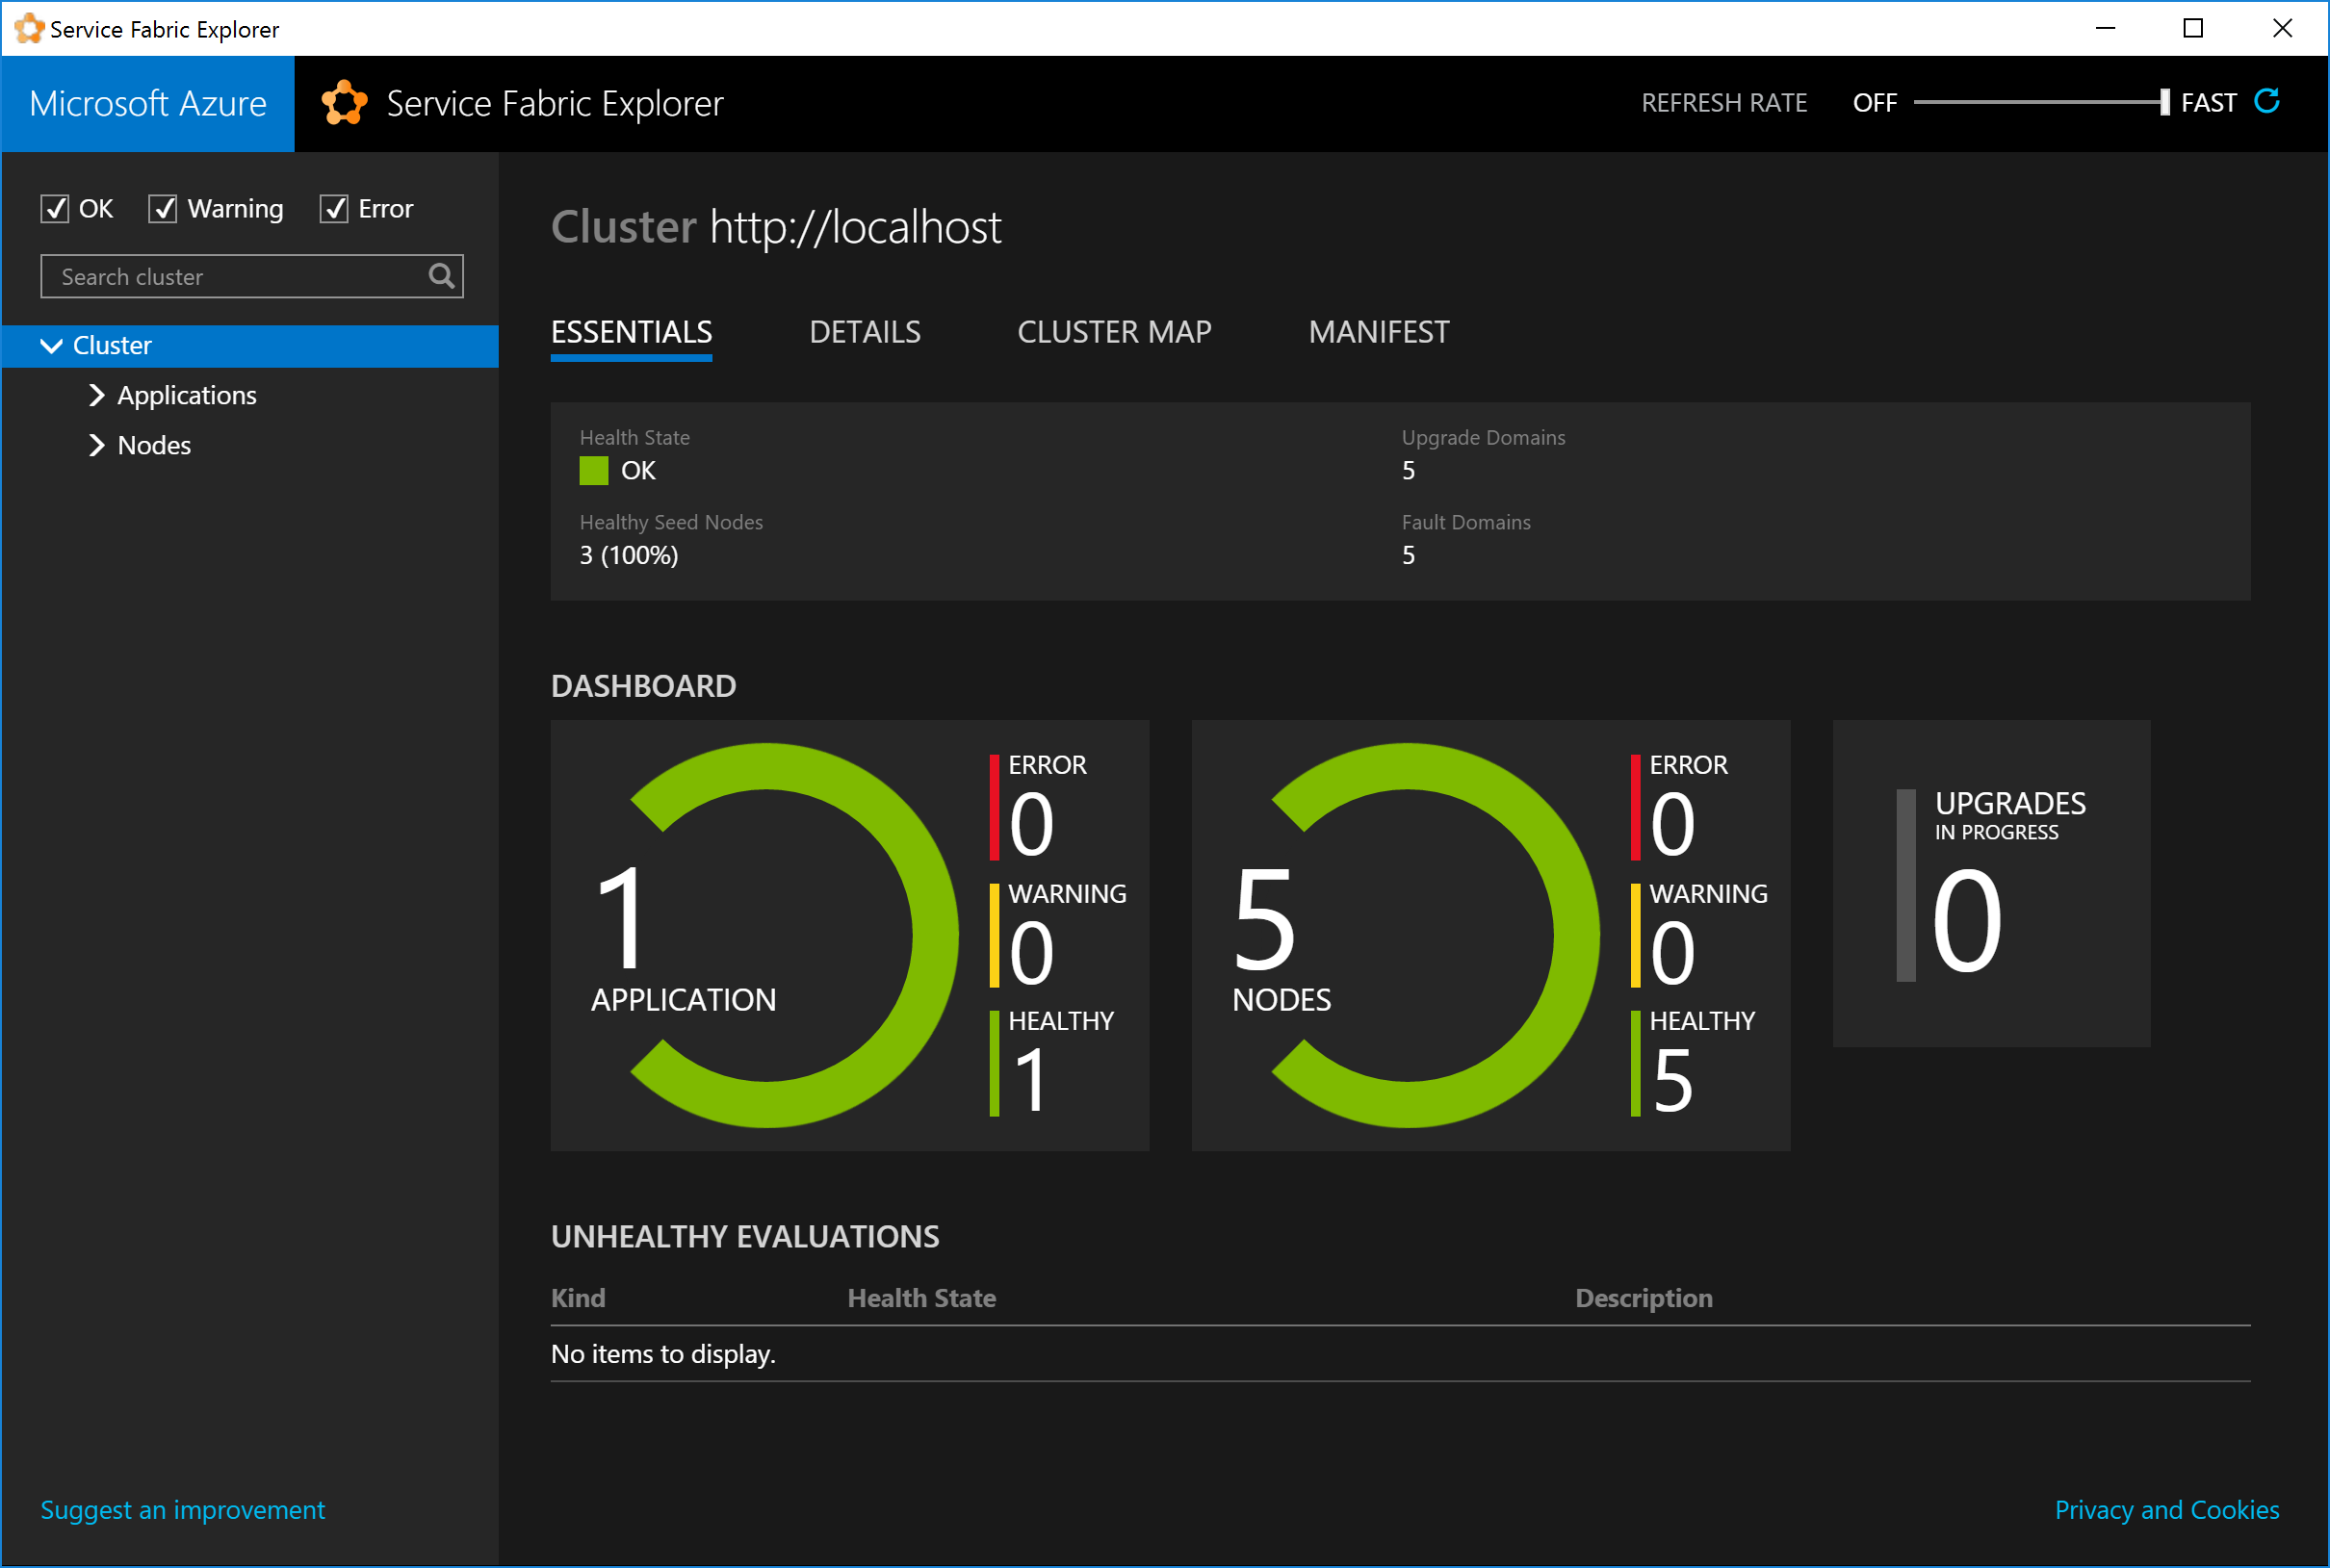
a year agoThe new web based fabric explorer has a much nicer interface than the old desktop application. However we’ve lost the ability to pin it to the taskbar for quick shortcuts win+n and having it as a chrome tab is less convenient than its own window.
Thankfully Chrome can help with that. Open the fabric explorer:
Create the desktop app:
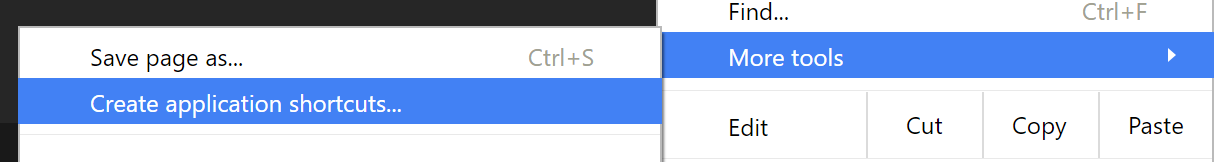
Then you can pin it to the taskbar as you would normally. You’ll get a window with all the extra Chrome removed.
Don’t forget to take advantage of the default windows taskbar keyboard shortcuts. I have it
pinned as the fourth taskbar item, so its quick to switch using win+4.
Use Visual Studio Code as the default Git editor
a year agoI am not familar with the default Vim editor that comes with Git, which makes interactive rebases difficult. It took me a while until I realised you can configure this. Thanks to F Boucheros this is quite easy!
git config –global core.editor “‘C:\Program Files (x86)\Microsoft VS Code\code.exe’ -w”
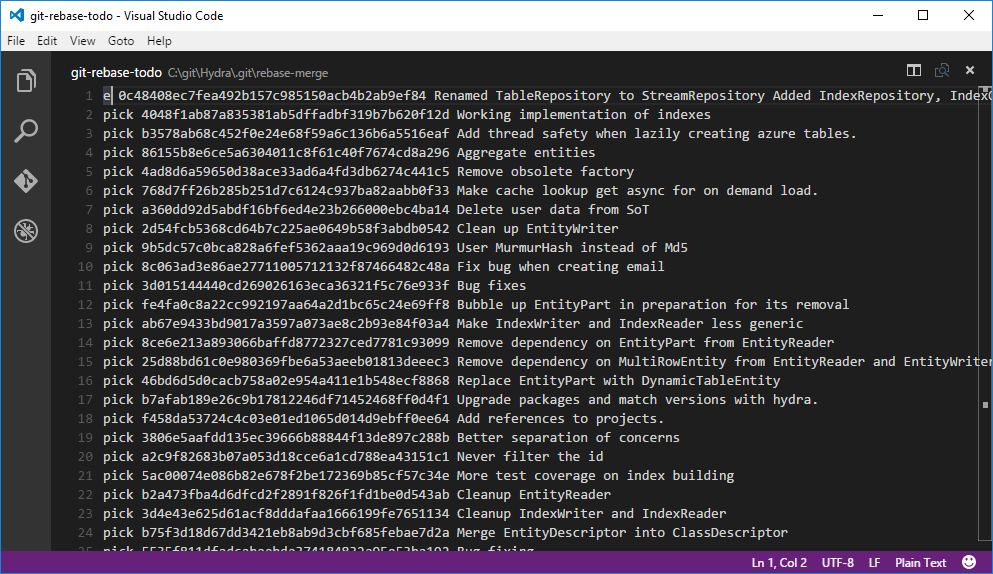
And now when you run your git rebase -i the todo log will open in vscode.
Publish live reliable actor telemetry from service fabric
a year agoAfter you’ve got your service fabric application live, you might see performance issues which you didn’t pick up in testing or simulated load tests. This could be for a number of reasons.
- Unexpected actor bottleneck, they are single threaded.
- Time spent waiting on a bottlenecked actor.
- Large state affecting IO performance.
Reliable actors do not yet have interception interfaces to add in this kind of detailed telemetry, but with careful code its possible to do this with a dynamic proxy. I chose to use LightInject for this but most of the framework would do the same job. I use statsd and graphite as my telemetry platform and I’ve had good experiences with this nuget package
We need to intercept object on both sides of the network boundary to cover these scenarios.
- Service fabrics initialisation to trace OnLoadStateAsync, OnActivateAsync, etc…
- Fabric client initialisation to trace client interface calls IActorInterface.YourDoWorkMethodAsync.
We can trace the former by using service fabrics dependency injection support to initialise the actors with a proxy inbetween. First we override fabrics initialisation to use our DI container which has dynamic proxy support.
|
Next we tell our DI container to resolve these types with a proxy that includes our telemetry interceptor.
|
This will catch the timings for any calls to actors made by the fabric system. Now we need to get the timings for all the calls we make, both actor to actor and client to actor.
|
Above we’ve created a factory class which should be used by clients and actors to create the proxied ActorProxies. We cache the generated proxy types in a thread safe dictionary as they are expensive to create.
Lastly we need the intercetor itself. We need to be sympathetic towards:
- All actor calls return a Task.
- Avoid blocking calls by calling
ResultorWaiton the task.
We can use a task continuation to handle the writing of telemetry together with a closure to capture the timer. If there is a return value we should return it, and for whatever reason that value is not a Task then we won’t try to add the continuation.
|
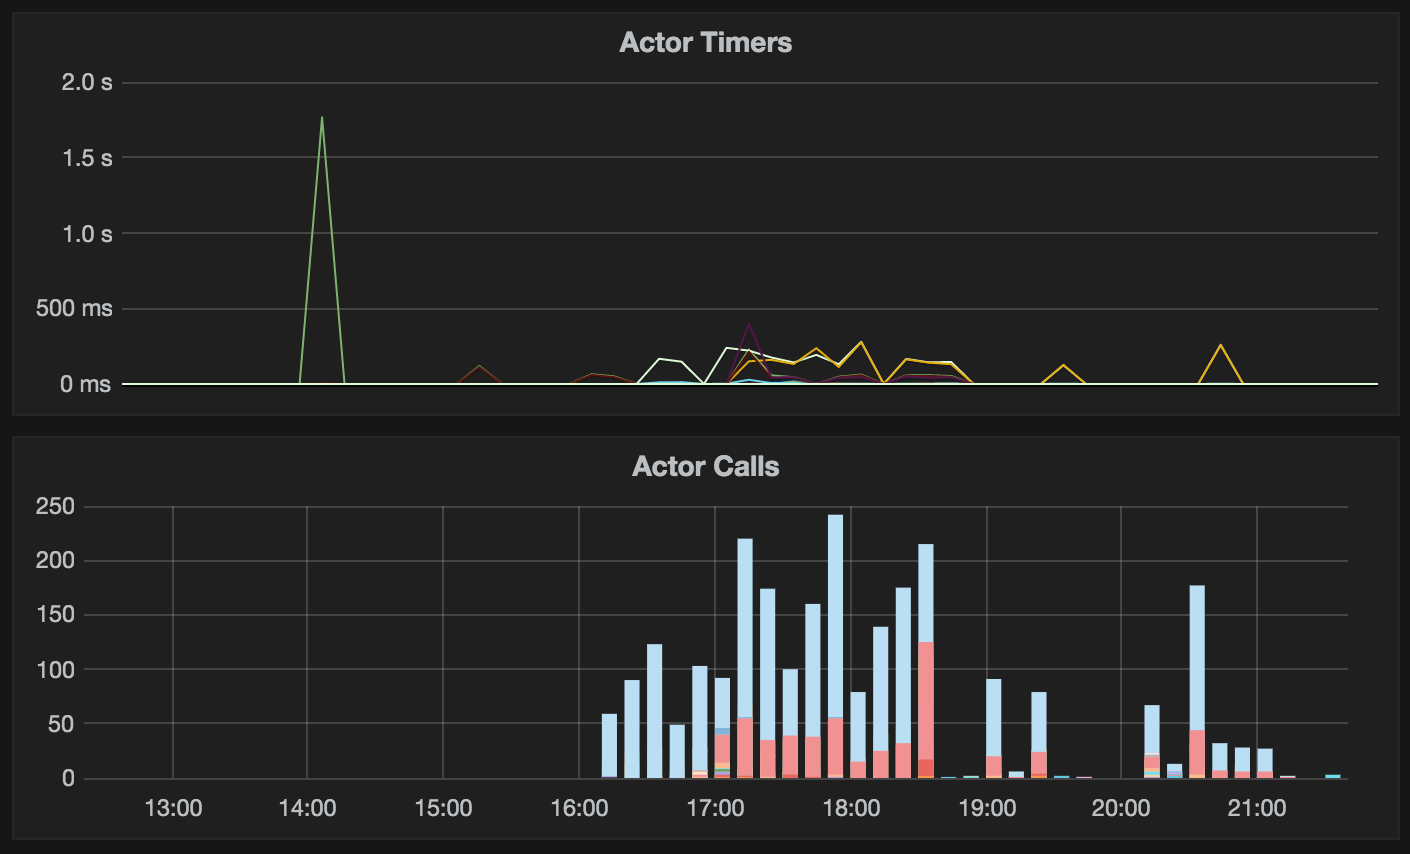
If you have your metrics library configured to push to a graphite backend you can use the following query to graph it:
|
A look at performance on .NET dynamic proxies
a year agoI currently use LightInject for dependency injection primarily for its good performance and well documented features. I needed to proxy our service fabric actors to trace call timings and I wanted to see if their interception package was competitive with other open source offerings.
We’ll take a look at:
- Castle Dynamic Proxy - This is likely the most popular dynamic proxy library for .NET.
- LightInject Interceptor - I hadn’t heard of this one until I started using LightInject.
- NProxy - Also a new one to me, but I’ve added it since it is easy to use.
Creating proxy instances
| Library | Average Time (us) |
|---|---|
| Castle | 2.5237 us |
| LightInject | 1047.9463 us |
| NProxy | 1.7470 us |
I was quite surprised to see such a difference between the frameworks. I guessed that both NProxy and Castle cache their proxy types internally, which LightInject expects you to handle your own caching. Something good to bear in mind!
After caching the proxy type things are a little more competitive:
| Library | Average Time (ns) |
|---|---|
| Castle | 2437.7655 ns |
| LightInject | 100.6836 ns |
| NProxy | 1670.7880 ns |
I still think the code can be more optimal in all cases, so I reduced everything as much as possible to a single call to activate the proxy type. I’ve included timings for Activator.CreateInstance and the standard constructor against the non-proxy type as a baseline.
| Library | Average Time (ns) |
|---|---|
| Castle | 109.5888 ns |
| LightInject | 99.2248 ns |
| NProxy | 1041.4311 ns |
| Activator | 77.9584 ns |
| Constructor | 6.7176 ns |
Things are much closer now! The difference between Castle and LightInject are negligible. There might be a way to optimise NProxy further but the API didn’t yield any obvious optimisations.
Calling proxied methods
Now let’s take a look at the runtime overhead of calling a proxied object. I’ve included an unproxied instance as a baseline.
| Library | Average Time (ns) |
|---|---|
| Castle | 2.9992 ns |
| LightInject | 2.9826 ns |
| NProxy | 2.9893 ns |
| No Proxy | 3.0494 ns |
Surprisingly there is no overhead with any of the libraries with calling the proxied object. The graph looks skewed due to how close the results are and the timings are in nanoseconds. This is great news and we can use whichever library we want guilt-free.
You can review the code for the benchmarks on github.
Getting the number of service fabric partitions
a year agoYou might need to programmatically lookup details about a service. The FabricClient class can be used to lookup various things from the cluster.
|
The result of GetPartitionListAsync should never change for a service as you can’t change the partition information after a service has been created. It would be safe and give better performance to cache this.
The endpoint of the primary replica however can move between machines, so this does need to be resolved more frequently. You can also cache this if you have a retry strategy that will re-resolve after an EndpointNotFoundException.
|
Sharding data across service fabric partitions
a year agoService fabric gives you two mechanisms out of the box when resolving which partition you hit when calling a Reliable Service. We’ll ignore the singleton partitions as they won’t help us with sharding.
- Named Partition - This is a fixed name for each partition configured at deploy time.
- Ranged Partition - This uses an
Int64range to decide which partition a numbered key falls in.
More information can be found here.
Named Partitioning
A named partition allows you to specify explicitly which partition you want to access at runtime. A common example is to specify A-Z named partitions and use the first letter of your data as the key. This splits your data into 26 partitions.
|
The advantages to this are that it is simple and you know which partition your data goes in without a lookup. Unfortunately as we will test later, you are unlikely to get a good distribution of your data across the partitions.
Ranged Partitioning
With a ranged partition the fabric tooling by default uses the entire Int64 range as keys to decide which partition. It will then convert these into ranges or buckets depending on the partition count.
|
However to be able to lookup a partition we need a function which can reduce our data to an integer value. To use the configuration above we can convert our strings into an Int64.
|
- Hash the value to a fixed length byte array.
- Convert the array to an
Int64. - Create the client with the calculated key to connect to the service on that partition.
Ranged Partition with Consistent Hashing
Rather than use the ranges, you can fix your keys and plug in your own hash algorithm to resolve the partition.
|
We now have a key range limited to 0-25 rather than the entire Int64 range. We can resolve a client connected to this partition in the same way, however this time we need to compute a key that fits in this smaller range. I’m using the jump consistent hash implementation in hydra.
|
- Call get shard with the value and number of partitions to distribute across.
- Create the client with the calculated key to connect to the service on that partition.
Distribution
To benchmark the distribution we have a list of around 17000 real email addresses. This should give us an idea of how the sharding strategies will distribute the data across 26 partitions. Another advantage of using one of the Int64 methods is that they can be used with any amount of partitions.
We are looking for an even number of accounts allocated to each partition.
| Partition | Alphabet | Consistent Hash | Ranging |
|---|---|---|---|
| 0 | 1569 | 684 | 650 |
| 1 | 912 | 682 | 730 |
| 2 | 1027 | 647 | 646 |
| 3 | 1175 | 662 | 701 |
| 4 | 513 | 687 | 700 |
| 5 | 415 | 665 | 658 |
| 6 | 581 | 653 | 684 |
| 7 | 466 | 693 | 637 |
| 8 | 405 | 657 | 690 |
| 9 | 1714 | 681 | 699 |
| 10 | 643 | 654 | 669 |
| 11 | 608 | 696 | 681 |
| 12 | 1800 | 734 | 665 |
| 13 | 526 | 717 | 647 |
| 14 | 213 | 693 | 613 |
| 15 | 793 | 693 | 676 |
| 16 | 31 | 654 | 683 |
| 17 | 1039 | 681 | 713 |
| 18 | 1562 | 661 | 665 |
| 19 | 803 | 708 | 747 |
| 20 | 46 | 653 | 709 |
| 21 | 268 | 693 | 666 |
| 22 | 301 | 678 | 679 |
| 23 | 55 | 702 | 675 |
| 24 | 134 | 670 | 708 |
| 25 | 136 | 737 | 744 |
We can see from those results that sharding using the first character of an email produces wildly different partition sizes, not what we want! Both the jump hash and integer ranging methods produced very even parition sizes.
Conclusion
Based on these results I would use the ranged partitioning method, it produces provides good balancing and is fast to compute. An additional advantage is you do not need to know the partition count in the code, just map your data to an Int64 and service fabric will do the rest.